Analysis output & dashboards
Analysis output & dashboards
Every analyzed file gets a dashboard: a view of what’s in the file, the charts that matter for that kind of log, and the issues the analysis found. Search (Quick Search, Deep Research) is how you drill in once you’ve seen it.
The dynamic dashboard
A bugreport, a pcap, a Perfetto trace, and a ramdump each get a dashboard with charts appropriate to that format. You don’t configure it.
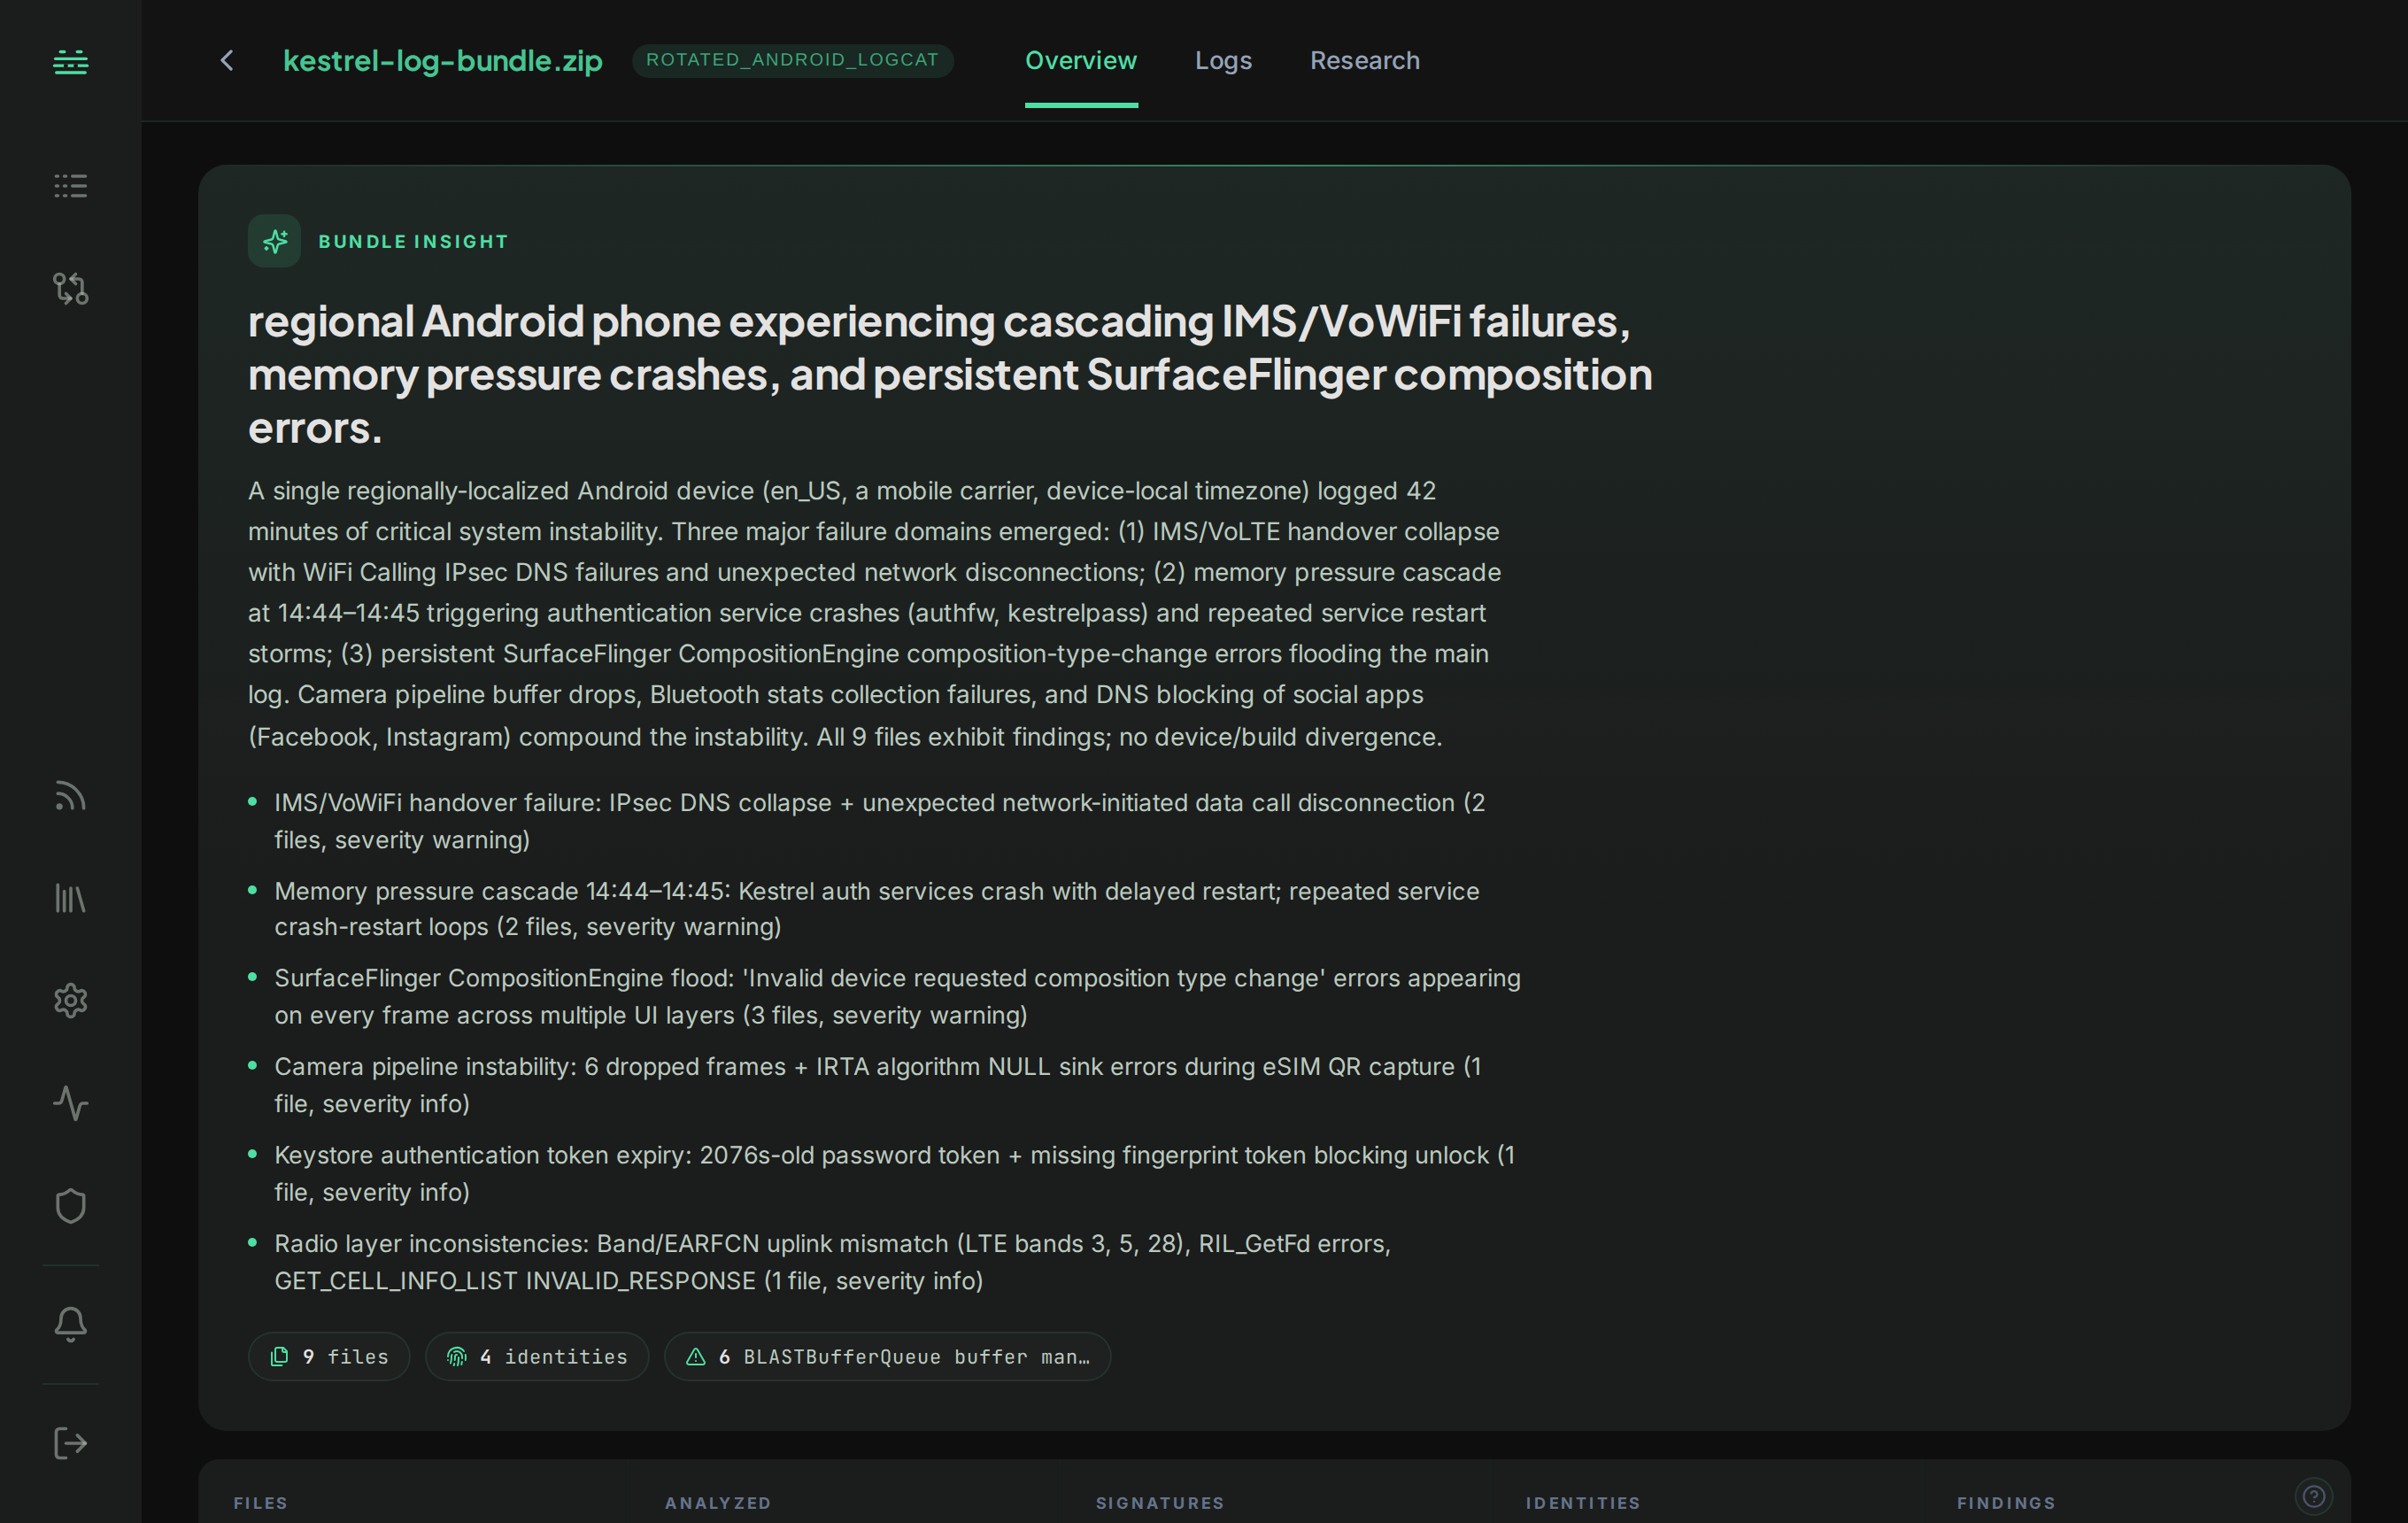
- Summary and device identity: every analyzed file opens with a short written read of what happened in it, and the device it came from (model, build, kernel, carrier) as far as the file itself evidences it. Both are drawn only from what the analysis confirmed in that file, so a file that says nothing about its device simply shows nothing.
- Curated charts: a fixed set that always renders for a given format. For an Android bugreport that’s the event timeline, battery-by-component, and severe-events-over-time; for telecom, a signal-strength timeline and RRC-state spans; for automotive, CAN-frames-by-ID; for a pcap, top talkers and flagged behaviors.
- Event timeline: for logs, a multi-lane timeline anchored to boot is the dashboard’s hero. It lays out what happened when, across subsystems, so you can see the sequence that led to a failure at a glance.
- Explorer: additional charts generated on demand from what’s actually in your file, beyond the curated set.
A file reads as completed once its results are ready to open. If you poll the API, wait for COMPLETED before fetching results; see Analysis lifecycle & polling.
Subsystem analysis
Each of these areas is analyzed, and contributes its findings:
- Application: crashes, ANRs, app lifecycle issues.
- CPU: load, scheduling, hot threads.
- Memory: pressure, leaks, low-memory kills.
- Network: connectivity, radio, data-path issues.
- Power: battery drain, wakelocks, thermal.
- Security: SELinux denials, permission anomalies.
- Storage: I/O, filesystem, space.
- System services: framework and system-server health.
- Timeline: the sequence of significant events.
- System health: overall device state.
The exact set depends on the format. A pcap or a Perfetto trace is analyzed across the areas that make sense for it. When you ask a question, the answer is grounded in these findings.
Insights
Every file’s dashboard opens with a summary of that file’s own findings: what the dominant failure is, whether several findings are facets of one incident or unrelated problems, and how much of the file they account for.
On multi-file uploads, findings also roll up to a bundle-level view: insights that no single file’s dashboard would show on its own, such as the same identifier failing across several logs. See Multi-file bundles.
Reading a dashboard
- Start at the top. The dashboard leads with identity and the highest-signal charts for that format: for a log, the event timeline; for a kernel dump, the fault that brought the machine down; for a pcap, the flagged behaviors.
- Scan the subsystem findings. Each analyzer’s issues are called out with severity, so triage is a glance, not a read-through.
- Drill in with search. When something looks wrong, ask about it: Quick Search for a fast answer, Deep Research for a full investigation. For a pcap, Perfetto trace, or ramdump, search queries the decoded capture itself, so you can ask for exact counts and slices.
- Export or share. Reports export to PDF and share via public link, with citations back to the source lines.
Next
- Deep Research: investigate a finding across layers.
- Quick Search: fast answers grounded in the analysis.
- Multi-file bundles: per-child dashboards and bundle-level insights.