Kernel dumps & References
Kernel dumps & References
logcat.ai performs forensic analysis on kernel crash dumps: the memory image a machine writes when its kernel goes down hard. Two shapes are accepted and both land on the same analysis:
- Linux kernel core dumps (vmcore), x86-64 or ARM64. The core a crashed Linux machine writes: a server, a VM, or an embedded board running a mainline or distribution kernel.
- Qualcomm device ramdumps: the multi-gigabyte collector output from a phone, tablet, or automotive head unit.
Upload the dump and logcat.ai recovers what the machine was doing at the moment it died. There are two levels of analysis. The second turns on when you upload a matching kernel debug image to the References library (below).
What gets accepted
- Linux core dumps (vmcore). Upload the file exactly as your collector saved it. Both the plain core and the compressed form most distributions produce by default work, with no need to expand it first. A capture compressed with a scheme we can’t read is refused with a message saying so, rather than analyzed incorrectly. The first tier of analysis needs no debug image, because the dump describes its own layout. See the capture note below for the one shape where that’s narrower.
- Qualcomm ramdump archives are the collector output: a directory of DDR/IMEM region blobs plus manifests (
load.cmm,dump_info.txt). The collector usually ships them as a.7z, but any supported archive works (.tar.gz,.zip, and so on). Upload the archive as-is. The region set is recognized from its contents and analyzed as one dump.
A crash capture is treated as a container, whether you upload an archive or a single dump file. The dump and anything recovered from it become files inside it, each analyzed on its own (see below).
Either shape needs the kernel crash dump analysis capability on your account. Without it the file uploads and is stored, but analysis stops there. See Plans & pricing.
Worth knowing before you capture
A dump taken from outside the machine (a hypervisor or cloud “dump this VM” action, which saves memory without the guest’s help) carries less to work from than one the machine’s own crash kernel wrote. On x86-64 we still recover the kernel log from it. On ARM64 that shape needs the matching debug image. If you get to choose, an in-guest capture gives you more either way.
The two analysis tiers
Without symbols (always available)
Even with no debug image on file, logcat.ai recovers the forensic signal the dump carries about itself.
From a Linux core dump:
- The recovered kernel log: the ring buffer as it stood at the crash. It also becomes a log of its own inside the capture, so you can read, search, and analyze it like any other log.
- Machine identity: the kernel release and the boot command line the machine was running.
- The fault the kernel reported: the panic, oops, or watchdog signature it printed on its way down, classified.
- Per-CPU state: where each processor was when it went down, from the registers saved in the dump. A register set that’s present but zeroed means that CPU never answered the crash, often the one that caused it, and it’s reported that way rather than as a CPU running at address zero.
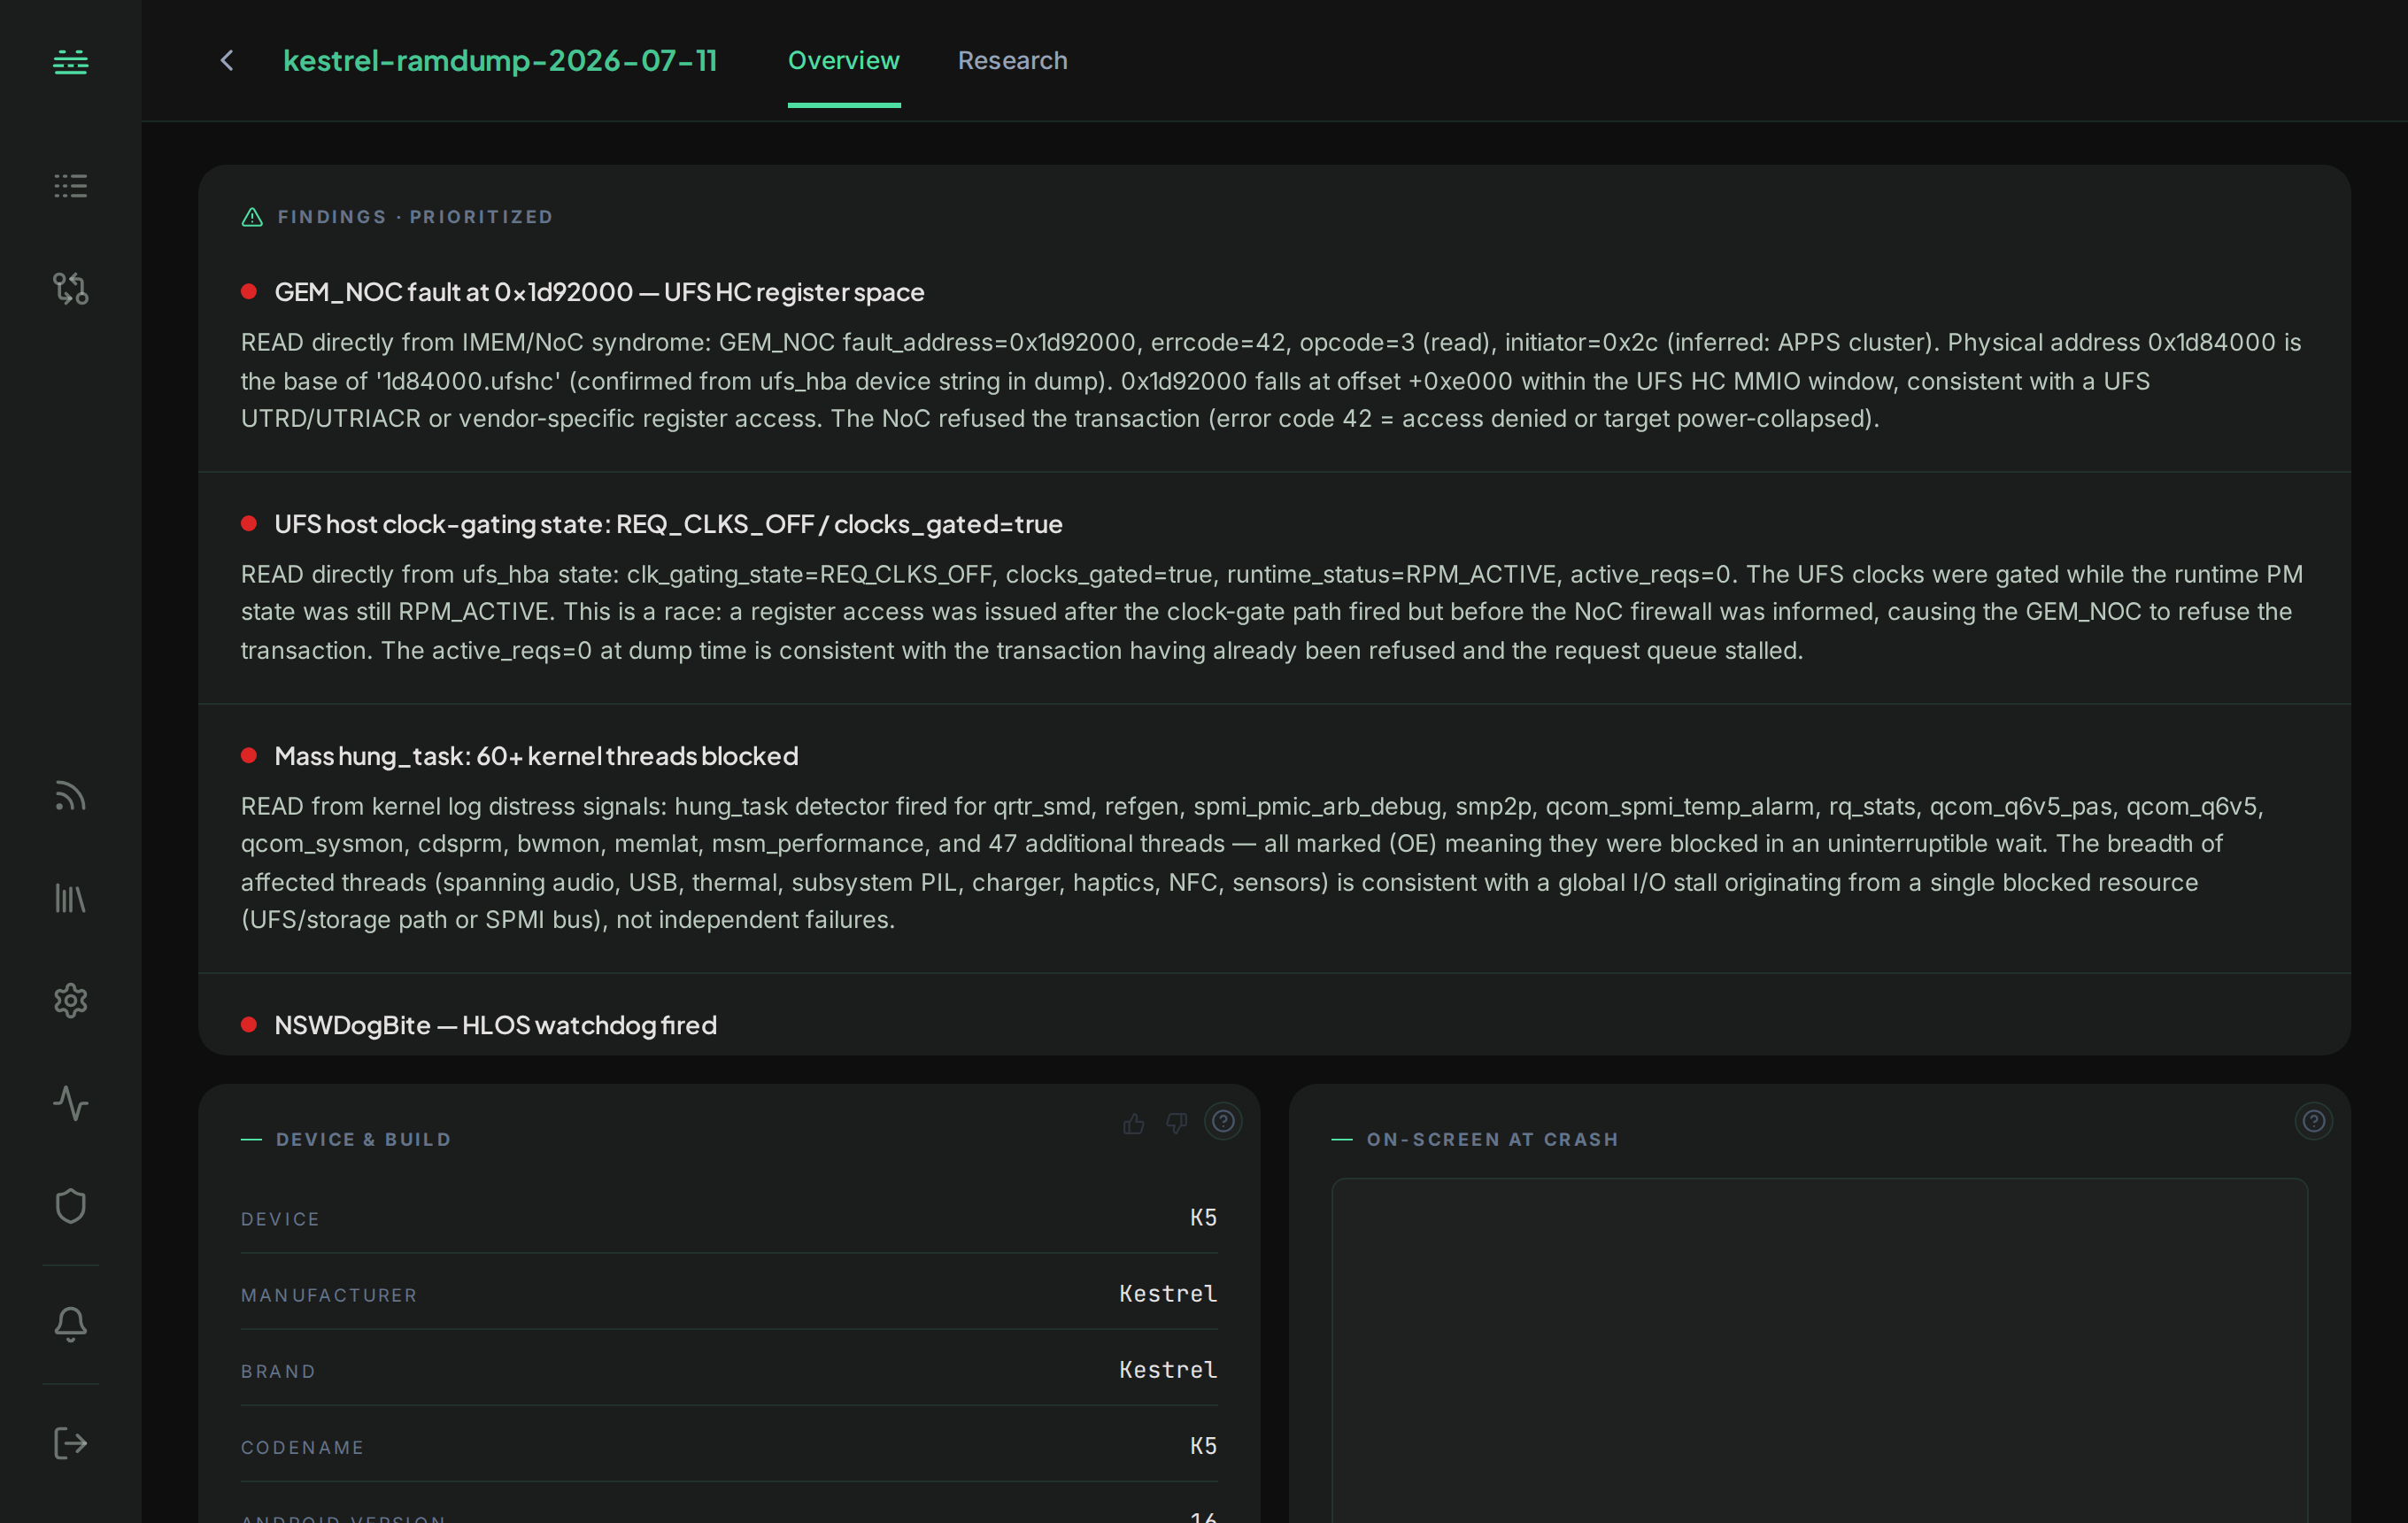
From a Qualcomm ramdump, the hardware-level signal a device dump carries instead:
- Reset reason: why the device went down.
- NoC (Network-on-Chip) faults: bus-level hardware fault captures.
- DCC registers: the hardware register snapshot captured at crash time.
- Secure-world event log: the trusted execution environment’s own event stream leading up to the reset. On a device where the kernel never panicked, this is often the only running account of what happened.
- Co-processor failure records: when a co-processor such as the modem stops, its firmware records why. That record is recovered verbatim, with its registers and the task that was running. Read it as the co-processor’s account of what it was told, not as the cause: a co-processor often stops because something else already failed.
Whichever you upload, the analysis says what it could and couldn’t read. “The kernel had nothing there” and “we couldn’t reach it” are reported as the different answers they are, so an empty result never has to be taken on trust.
With symbols (upload a matching debug image)
Upload the debug image for the exact kernel build to the References library, and the analysis reads struct layouts from its DWARF debug info and walks the dump’s memory to recover:
- The crashing task’s backtrace: the call chain of whatever each processor was running at the moment of capture, recovered from the registers the crash kernel saved. This is the one backtrace out of the hundreds in a dump that describes the crash rather than a task that happened to be asleep during it. It’s shown as a numbered call chain, innermost frame first, with a line underneath saying how it was read: a walked chain is a call sequence, and a scan is a list of addresses that were on the stack, shown unnumbered because their order isn’t a call order. Long chains show the innermost frames and say how many they’re of. Core dumps carry the saved registers this needs; a device ramdump does not, so it’s reported there as not available rather than as an empty result.
- Tasks waiting in uninterruptible sleep: tasks blocked on something they couldn’t be woken out of, each with the call chain showing what it was waiting in, deepest chain first. Kernel threads parked in that state by design are left out, so this stays a short list rather than a census.
- Tasks and runqueues: what every process and CPU was doing.
- Loaded modules: the driver list, named from kernel memory.
- Per-process memory: the memory map of each process.
- Stalled waiting: how much of the preceding ten seconds, minute and five minutes tasks spent stalled waiting for CPU, memory or storage, per resource. These are the only figures in a dump that describe the period before the capture rather than the instant of it, so a value falling left to right means the machine was recovering and rising means it was getting worse.
- Memory at capture: what the machine’s memory was holding at the moment it was taken, as shares of the total: process memory, page cache, shared, and free.
- Mounted filesystems: every mounted volume, its type, and whether it was read-only at the time of capture. Android mounts its system volumes read-only by design, so this matters when a volume that should be writable isn’t.
- Recovered logs: the kernel log is reconstructed from memory, and on an Android device the userspace logcat with it. Each appears as its own file inside the capture, with a dashboard and full search. Open the capture to see everything it holds.
- Screenshot recovery: on a device dump, the on-screen framebuffer at crash time, when present.
A production core is often stripped of the memory some of these need. Where that’s the case, the analysis says the capture doesn’t hold it rather than reporting an empty result.
Until a matching debug image is in the library, a dump is analyzed on the first tier. Upload one later and re-run the analysis to pick up the second.
The References library (kernel symbols & DBC)
References holds the symbols and definitions that turn opaque captures into named data. It’s scoped to your organization, under References in the console.
- Kernel debug images: matched to dumps by build ID, so one upload covers every later dump of that exact build, Qualcomm ramdump or Linux core dump alike. A kernel version isn’t specific enough on its own, since a distribution ships many builds under one version: if the only image on file is a different build of the same version, the dump is analyzed without symbols and the analysis says so rather than using it. Either form works: a full
vmlinux, or the separate debug file your distribution ships for that kernel (often namedvmlinux-<version>or ending in.debug, from a-dbgor-debuginfopackage). Because these exceed the normal upload cap, upload through the References tab. One is also picked up automatically if it ships inside a dump archive. - DBC files: the CAN signal database used to decode automotive candump traces. Register a DBC once and matching CAN traces are decoded against it automatically. See Preparing automotive logs.
Example questions to ask
Ask from the Research tab once the dump is analyzed. Reach for Quick Search when you already know what you’re after, Deep Research when you need the root cause.
Quick Search for fast, cited lookups:
- “What fault did the kernel report?”
- “What were the CPUs running when it crashed?”
- “Show me the last kernel log lines before the crash.”
- “Which modules were loaded?”
- “What was the reset reason?” (device ramdumps)
- “Were there any NoC or bus faults?” (device ramdumps)
Deep Research for multi-step root-cause investigations:
- “Why did the kernel go down?”
- “Trace the fault that triggered the watchdog.”
- “What stalled the storage path in the seconds before the crash?”
See Quick Search and Deep Research for how the two modes differ.
Next
- Multi-file bundles: how a dump archive composes with the logs inside it.
- Analysis output & dashboards: the dump dashboard, which opens with the kernel’s own last words and then shows identity, where the machine was at capture, each processor’s state, blocked tasks, stall pressure, memory, recovered logs, and on a device dump the reset reason, hardware faults, and recovered screenshot.
- Supported file types: the full accepted/rejected list.