Network captures (pcap)
Network captures (pcap)
Upload a .pcap or .pcapng and logcat.ai
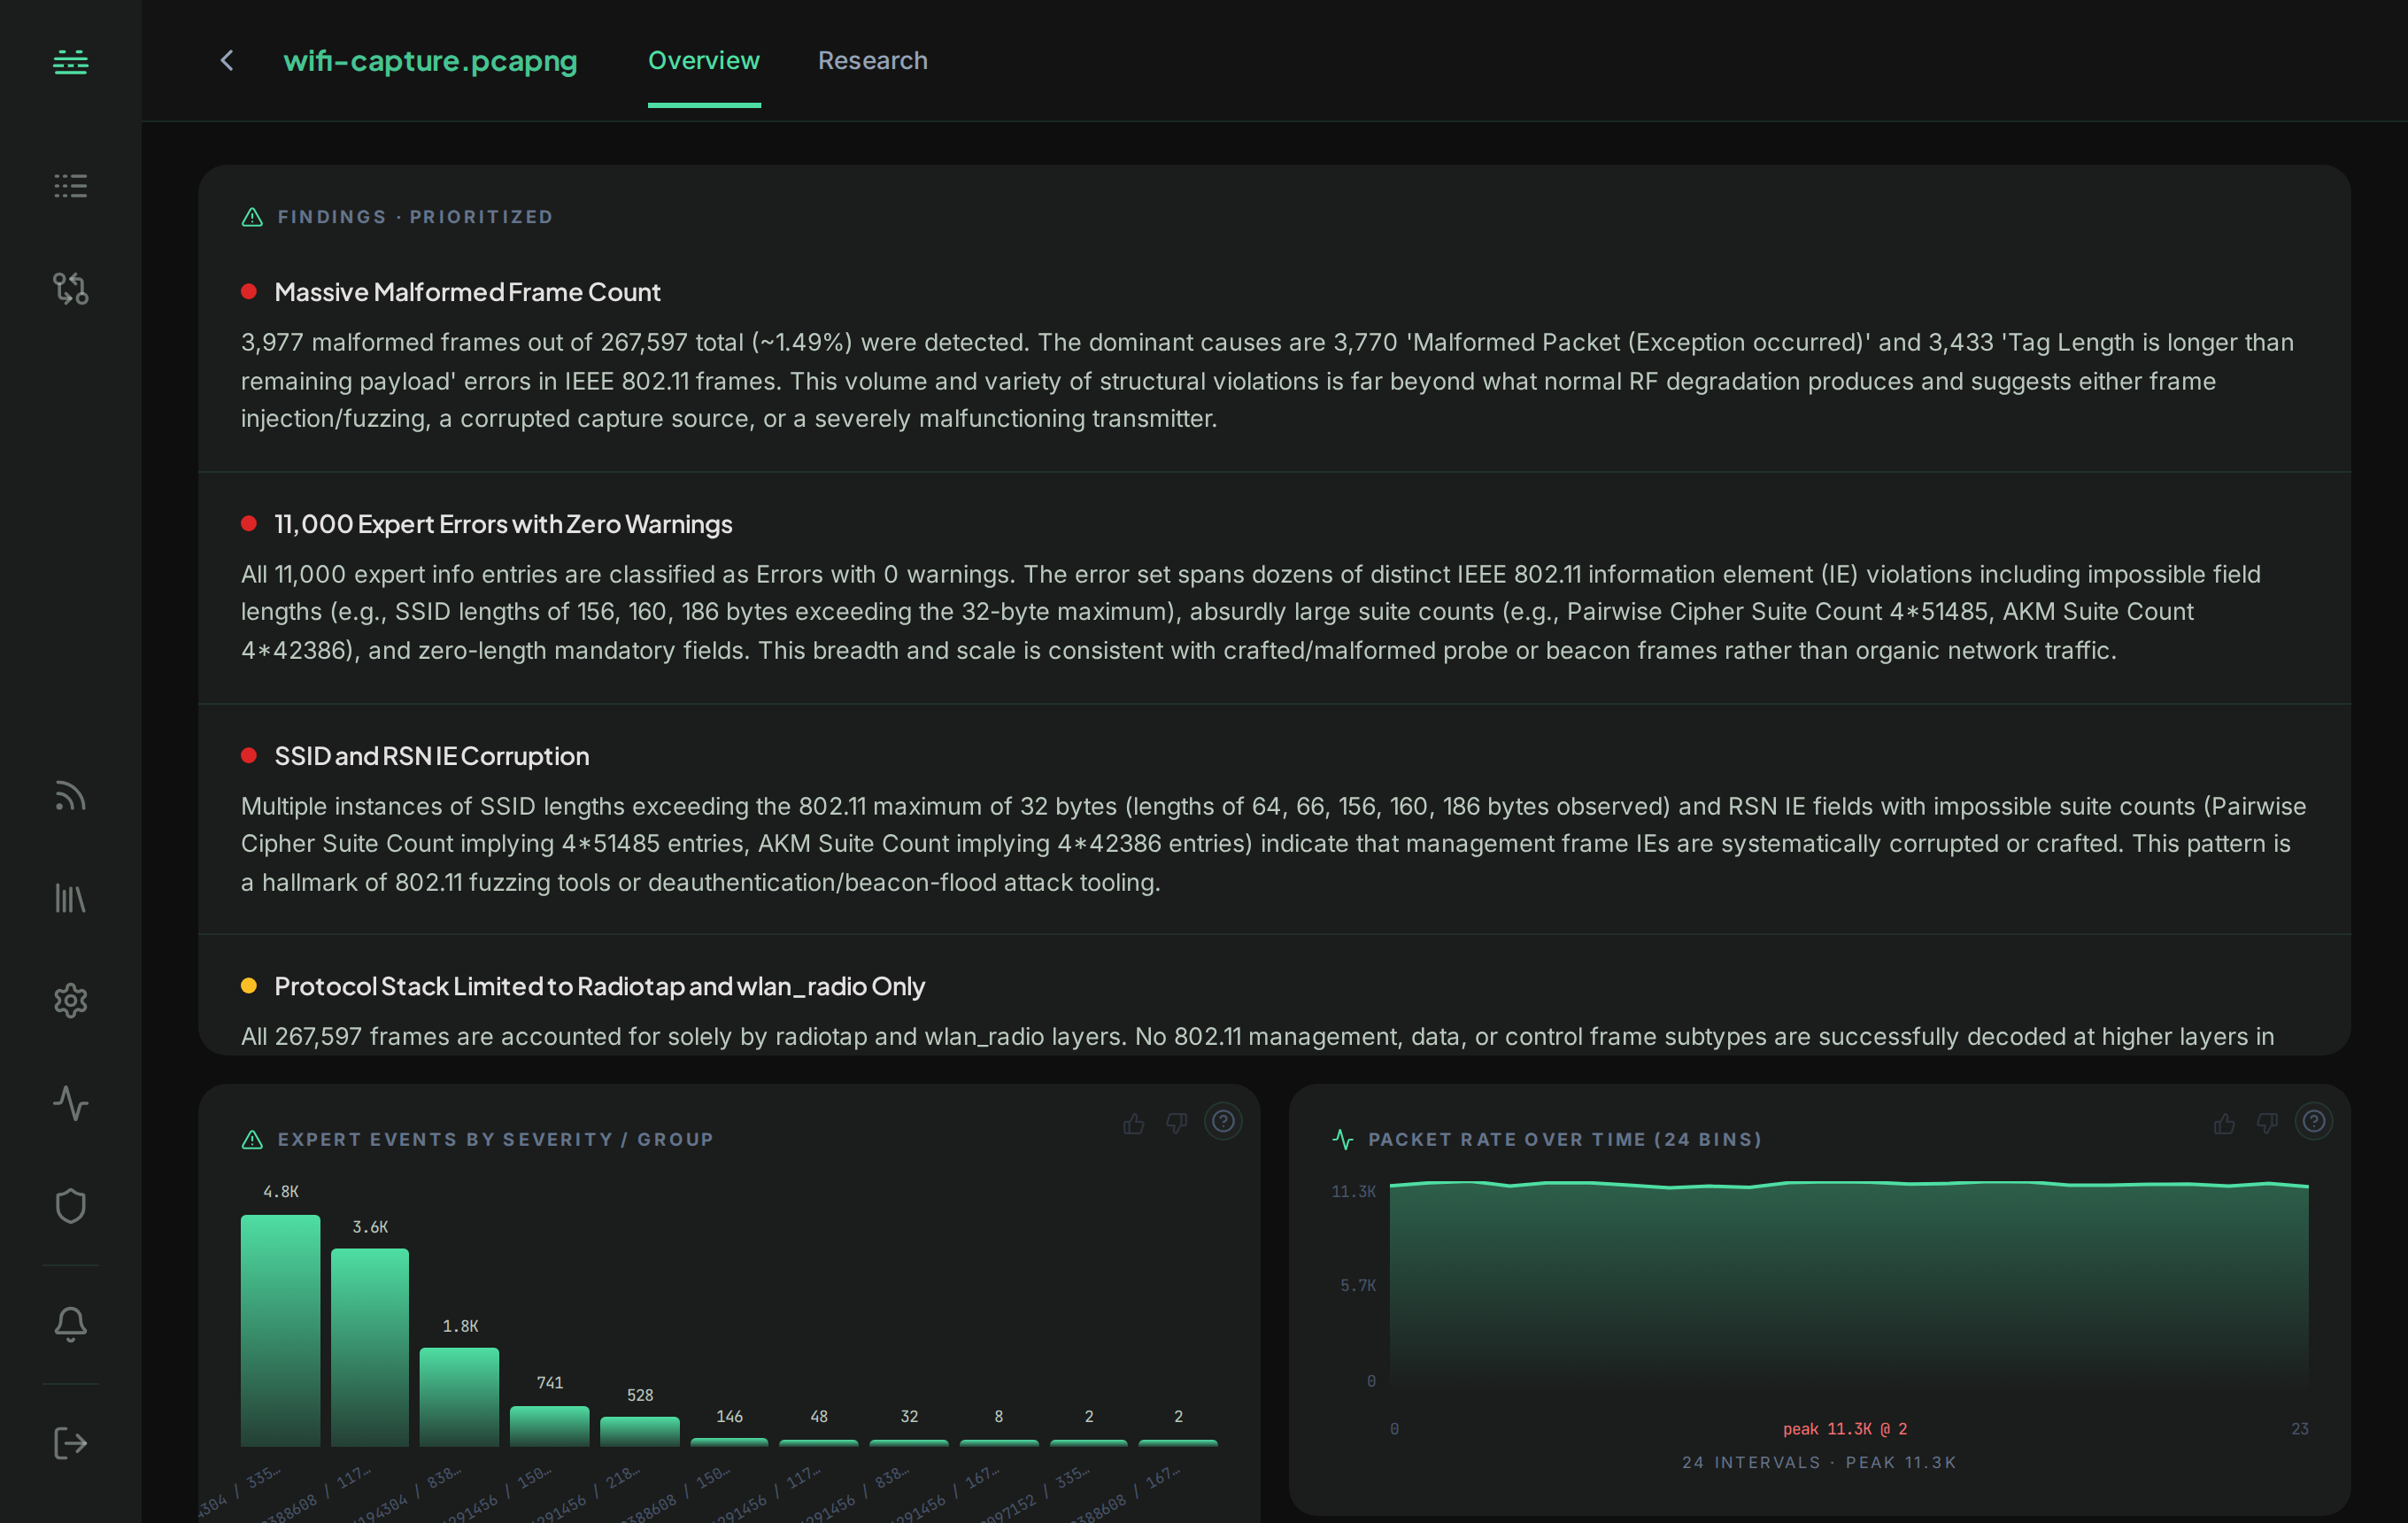
decodes it, builds a queryable model of every packet and flow, fingerprints the TLS handshakes, runs threat heuristics, and renders a network dashboard. You investigate it the same way you would a bugreport.
What gets accepted
.pcap: classic libpcap captures (tcpdump, Wireshark “Save As pcap”)..pcapng: the modern pcapng container, including multi-interface captures.
Captures are decoded automatically at ingest. You upload the raw binary capture directly, no text export step.
How a capture is analyzed
A capture is decoded into structured, queryable data rather than searched as text, so questions about flows, endpoints, and byte counts get exact answers:
- Packet and flow model. Every packet and conversation is queryable, so an investigation can run real SQL over the capture (protocols, endpoints, ports, byte counts, timing).
- TLS fingerprints. JA3 / JA3S client-and-server handshake fingerprints and HASSH SSH fingerprints are computed, so you can identify clients, servers, and tooling even inside encrypted traffic.
- Threat detection. Rule-based checks flag port/host scanning, beaconing (regular call-home intervals), and DGA-style domain patterns.
- Ask in English, get exact answers. Quick Search and Deep Research query the decoded capture directly, drilling from a broad question down to the specific flows that answer it.
- Network dashboard. The findings render as charts: top talkers, protocol breakdown, flagged behaviors, and the fingerprint tables. See Analysis output & dashboards.
Example questions to ask
Ask from the Research tab once the file is analyzed. Reach for Quick Search when you already know what you’re after, Deep Research when you need the root cause.
Quick Search for fast, cited lookups:
- “What hosts did this device talk to, and over which ports?”
- “Show me the TLS clients by JA3 fingerprint.”
- “Which flow moved the most bytes, and to where?”
- “Was there a port scan in this capture?”
Deep Research for multi-step root-cause investigations:
- “Is there any beaconing or regular call-home activity?”
- “Why did the TLS handshakes fail?”
- “Is this capture consistent with a scan or an attack?”
See Quick Search and Deep Research for how the two modes differ.
Capturing a pcap
Any standard capture tool produces an accepted file:
# tcpdump on the device or a mirror port
tcpdump -i any -w capture.pcap

# tcpdump on a specific interface, with a capture filter
tcpdump -i eth0 -w capture.pcapng 'tcp port 443'
Upload the resulting .pcap / .pcapng directly.
Next
- Analysis output & dashboards: what the network dashboard shows.
- Deep Research: multi-step investigations that query the capture engine directly.
- Supported file types: the full accepted/rejected list.