Perfetto traces
Perfetto traces
Upload a Perfetto trace and logcat.ai opens it as structured, queryable data, analyzes it across the major system subsystems, and lets you query it in SQL or plain English. You investigate it the same way you would a bugreport.
What gets accepted
- Perfetto trace files. The
.perfetto-trace/.pftraceoutput from Perfetto (the on-device tracer,record_android_trace, or the Perfetto UI’s captured traces).
Traces are decoded directly. Upload the trace file as captured, no conversion step.
How a trace is analyzed
Slices, counters, and scheduling events are queried directly rather than searched as text, so you get exact answers:
- SQL over the trace. The trace is loaded as structured tables, so analysis and search run real SQL over it.
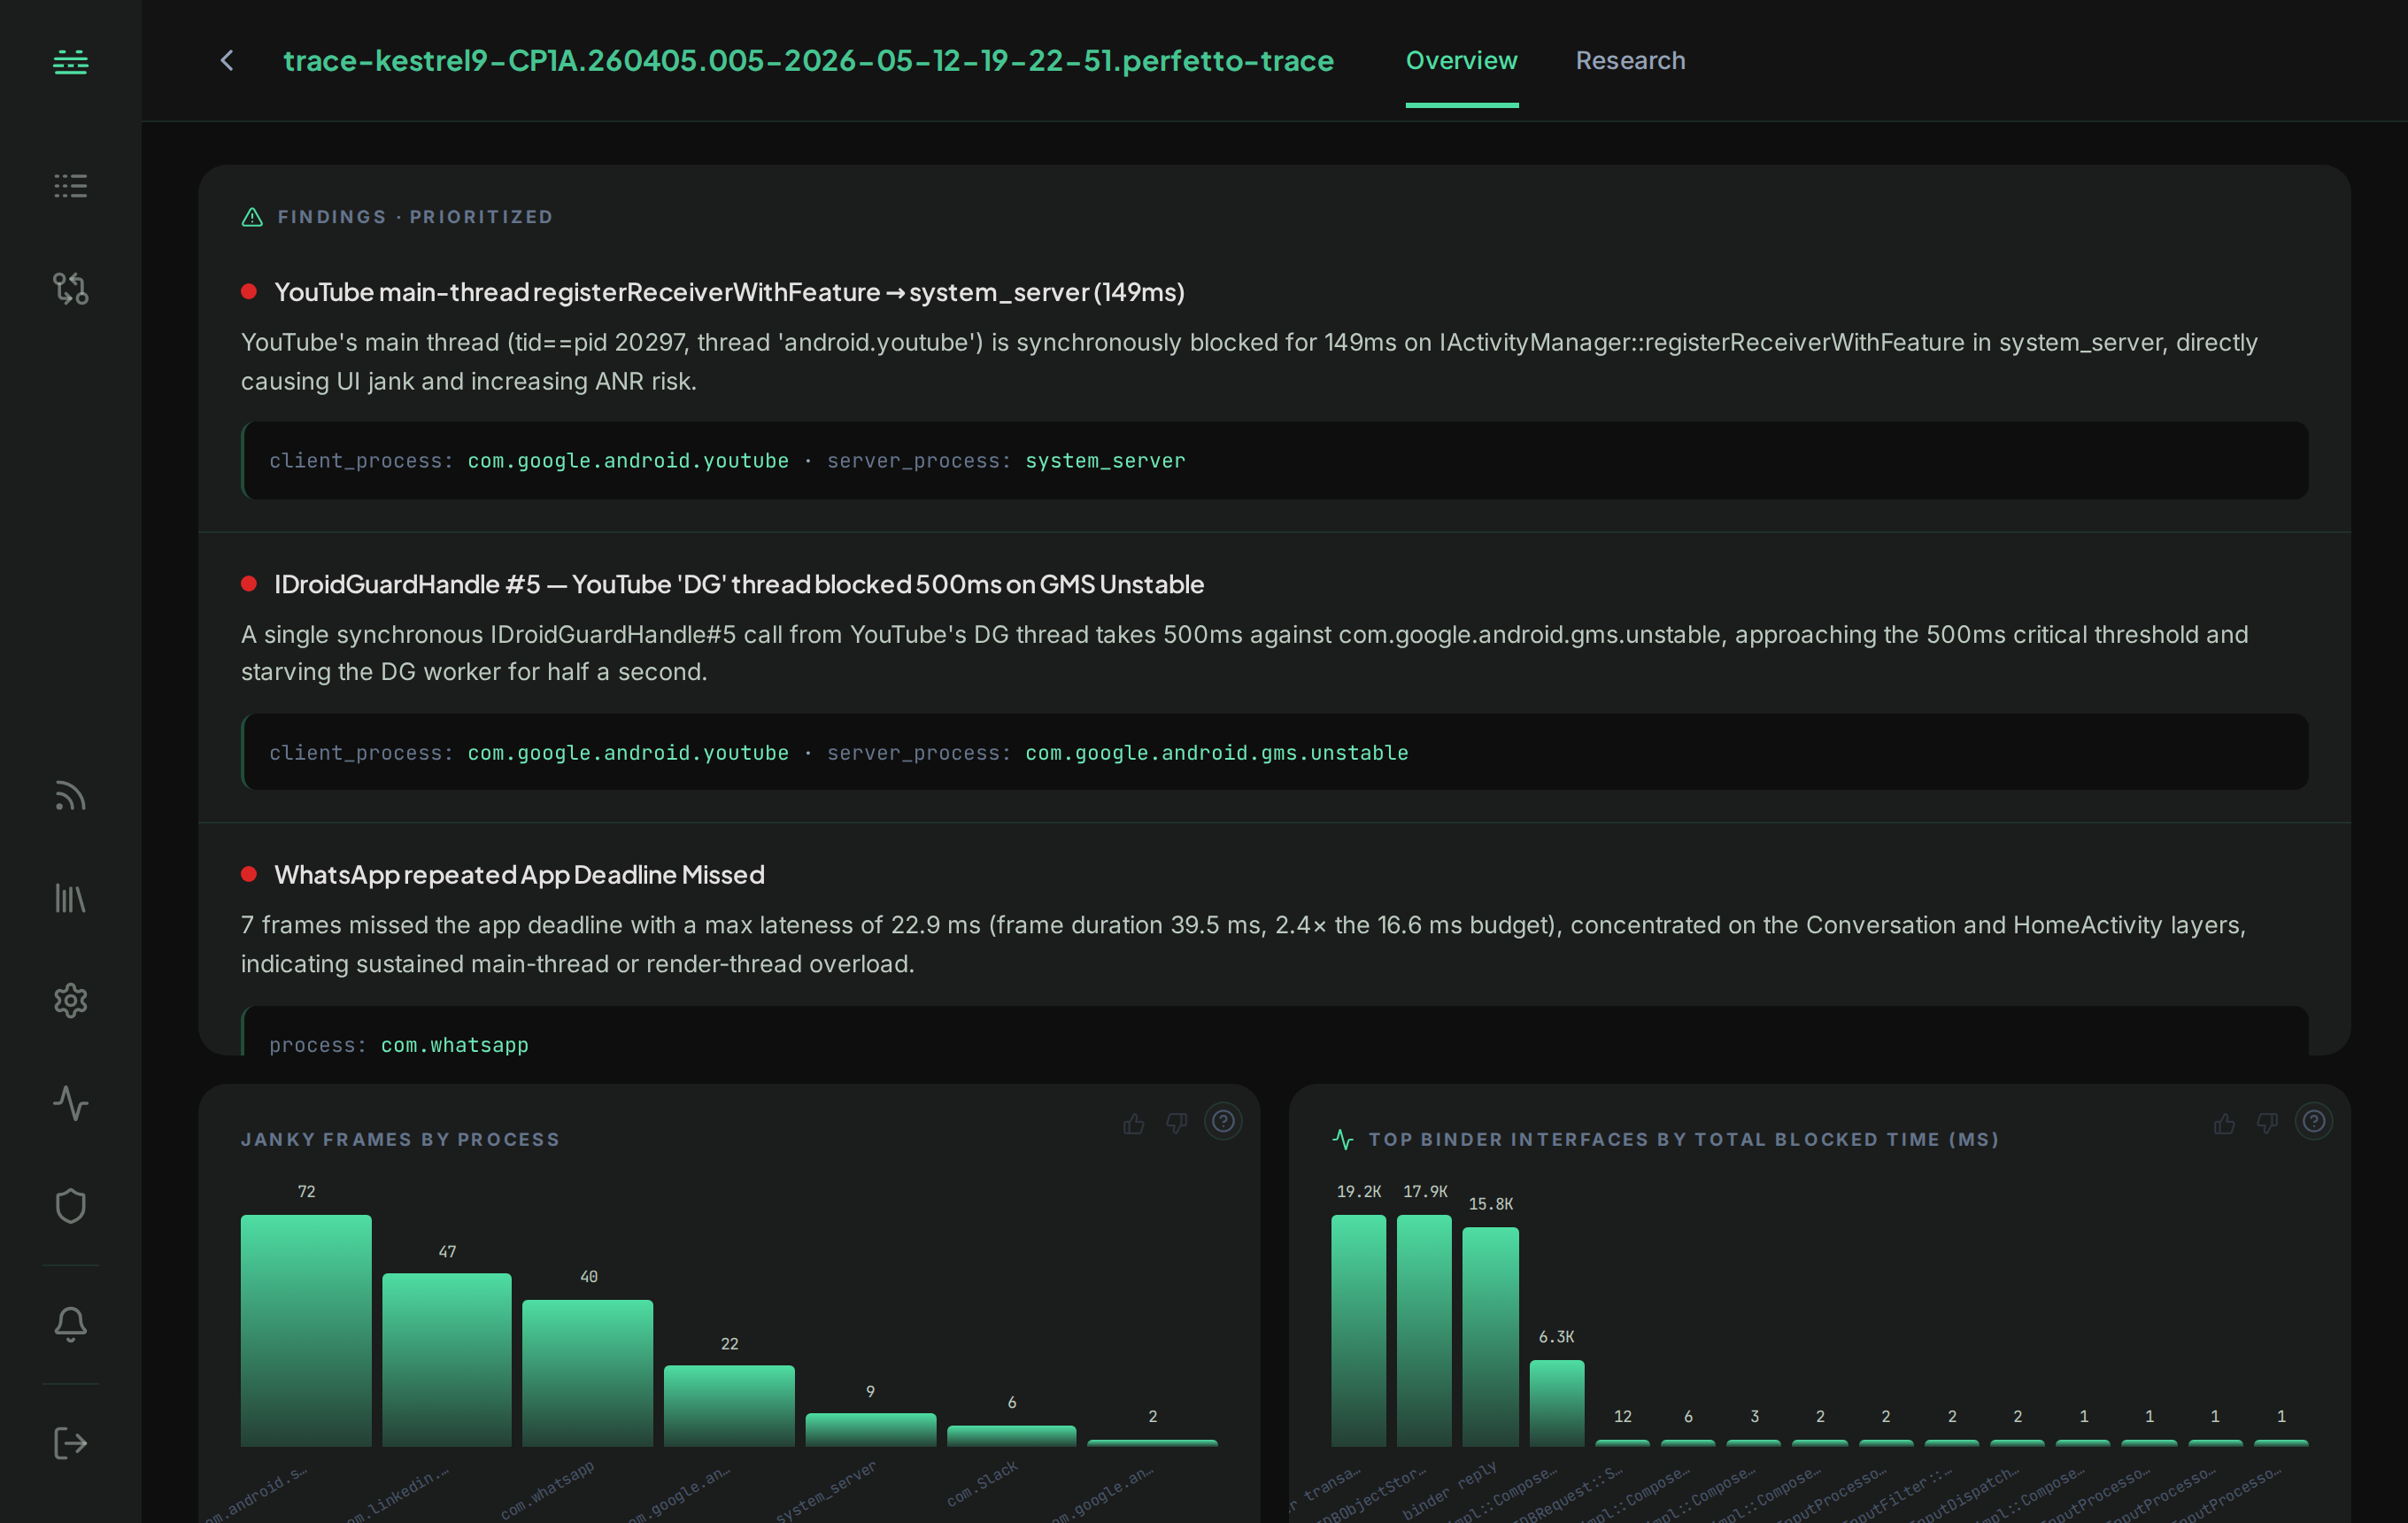
- Multi-subsystem analysis. The trace is broken down across CPU scheduling, frame timing, memory, power, and I/O, with the findings called out by severity.
- Ask in English, get exact answers. Quick Search and Deep Research query the trace directly, drilling from a broad question down to the specific slices and counters that answer it.
- System-performance dashboard. Findings render as charts. See Analysis output & dashboards.
Example questions to ask
Ask from the Research tab once the file is analyzed. Reach for Quick Search when you already know what you’re after, Deep Research when you need the root cause.
Quick Search for fast, cited lookups:
- “Which processes had the most janky frames?”
- “Which threads were hottest on the big cores?”
- “Show me the longest binder transactions.”
- “What was the CPU frequency doing during the slow scroll?”
Deep Research for multi-step root-cause investigations:
- “Why is app launch janky?”
- “What was blocking the main thread during scroll?”
- “Trace the cause of the dropped frames around the 2-second mark.”
See Quick Search and Deep Research for how the two modes differ.
Capturing a trace
Capture with Perfetto on-device or via the Perfetto UI, then upload the resulting trace file:
# On-device system trace via the Android helper
record_android_trace -o trace.perfetto-trace -t 10s sched freq idle am wm gfx view
Or record from ui.perfetto.dev and download the trace.
Next
- Analysis output & dashboards: what the trace dashboard shows.
- Deep Research: multi-step investigations that query the trace engine directly.
- Supported file types: the full accepted/rejected list.